Prometheus
Scrape Hanzo IAM metrics with Prometheus.
Hanzo IAM serves /metrics (alongside /healthz and /readyz) on a second
listener — the ops listener — and never on the public port. A liveness probe
or a scrape must not queue behind public traffic, so the two are separate
sockets:
| Listener | Flag | Default | Serves |
|---|---|---|---|
| Public HTTP edge | --http | http://:8080 | the IAM API |
| Ops | --ops | http://:9090 | /healthz, /readyz, /metrics |
An empty --ops binds nothing — correct for a grafted IAM, where the host owns
liveness, and wrong for a standalone one, which is why it defaults on.
Point the scrape job at the ops address:
global:
scrape_interval: 10s
scrape_configs:
- job_name: 'iam'
static_configs:
- targets: ['localhost:9090'] # Hanzo IAM ops listener, not the API port
metrics_path: '/metrics'Prometheus itself also defaults to :9090. On one machine, move one of them —
run IAM with --ops http://:9091 (and scrape that), or start Prometheus with
--web.listen-address=:9091.
In Kubernetes, name the ops port on the container and let the ServiceMonitor target it by name; the deployment owns the ops address, not the binary.
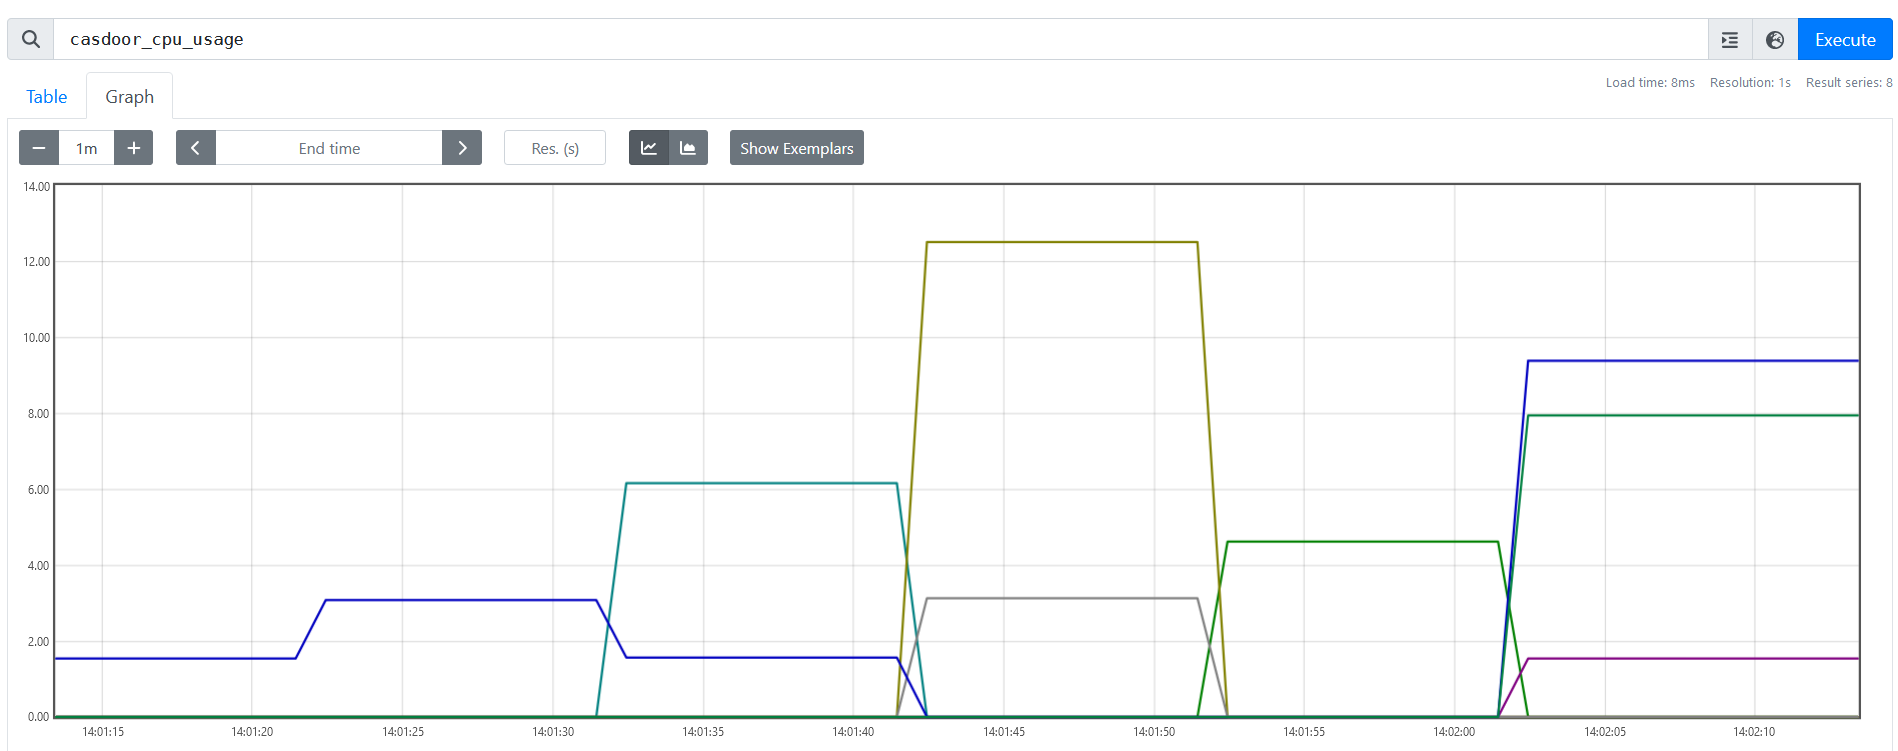
After Prometheus is scraping, query and visualize the metrics (e.g. in Grafana).

How is this guide?